
In the 2001-2002 school year, iLearn Math was implemented in a rural, high poverty Title I middle school in the state of Georgia with a high minority population. Seventy-four percent (74%) of the students in the district are eligible to receive free/reduced lunch. iLearn Math was implemented with entire classes in 2 computer labs with 20 computers in each lab. Each lab was staffed by a teacher. Neither teacher was certified in math; both taught business and career subjects. iLearn Math had not been used prior to the study in this school district.
The participants were 94 sixth grade students who were assigned to the iLearn Math or Control Groups by the principal. The groups showed no statistically significant differences on an experimenter-developed pretest. Both the iLearn and Control groups for each grade were enrolled in a general education math class that met for 40 minutes per day, 5 days per week. The iLearn Group was scheduled to receive supplemental instruction using iLearn Math for one class period, approximately 40 minutes per day, 5 days per week.
The two teachers received 4 hours of training on how to use iLearn Math prior to the first class. In March, near the end of the school year, students were tested on two standardized tests, the Iowa Test of Basic Skills (ITBS), and Georgia's Criterion Referenced Competency Test (CRCT), as part of the school's normal testing program. The results on these tests were analyzed by comparing the performance of students who received iLearn Math instruction to the Control Group that did not receive iLearn Math.
The results are summarized in Charts 1 through 4 below.
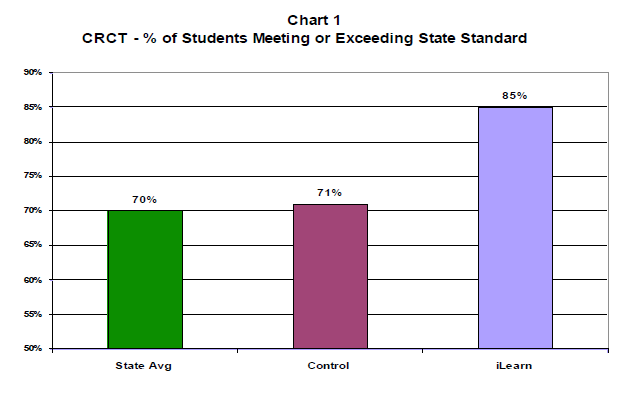
Chart 1 above shows the results from the CRCT. The percent of students meeting or exceeding the state standard in the iLearn Math Group was 85% vs. 71% for the Control Group, and 70% for the state as a whole. Thus, the use of iLearn Math resulted in a substantial improvement in scores on the CRCT. Another way to express this difference is that the use of iLearn Math reduced the failure rate from 29% to 15%, which is a reduction of almost 50%. The results for the percentile rank scores from the ITBS are shown in Chart 2 below.
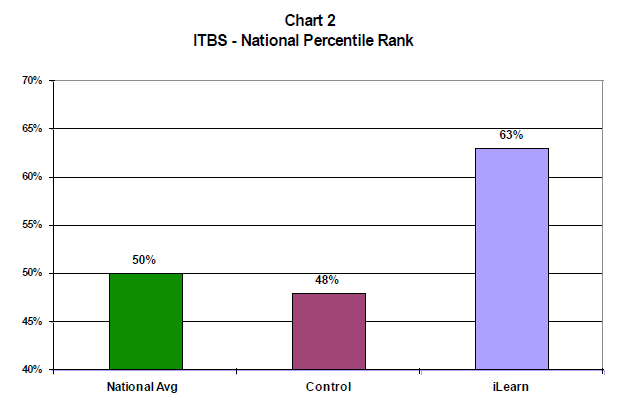
As shown above, the students in the iLearn Group out-performed the students in the Control group by 15 percentile points. The iLearn Group scored at the 63rd percentile while the Control Group scored at the 48th percentile. This represents a very large gain in percentile rank in one year. The relative magnitude of this gain can be seen in Chart 3 below, which shows the same data along with data on the same test for the same school in two prior years.
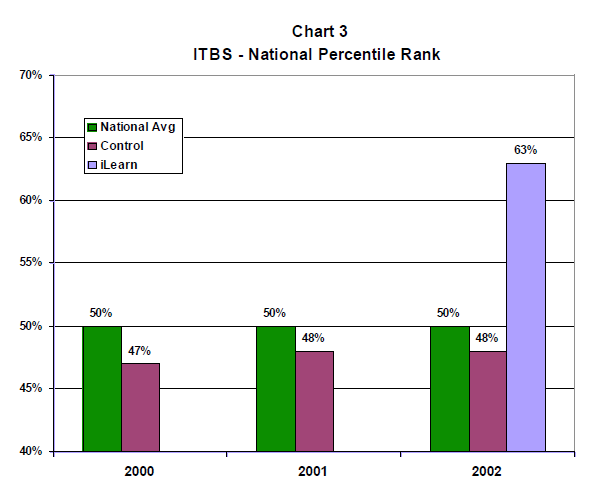
In the two years prior to this study, the sixth grade students had scored at the 47th and 48th percentile, which is comparable to the 48th percentile for the students in the Control Group of this study in 2002. This is below the national average (50th percentile) in each case. The students in the iLearn Group scored at the 63rd percentile, which is well above the national average. This is a substantial increase relative to the normal variation in scores at that school.
These results from the ITBS were also reported as grade equivalent scores. The control group averaged grade 6.6 on the ITBS, whereas the iLearn Group averaged grade 7.6. Thus, the iLearn Group outscored the Control Group by one full grade level over the course of one school year, which is a remarkable gain.
Another impact of iLearn can be seen by examining the scores on the subscales of the Georgia CRCT. The math portion of the Georgia CRCT administered in this study was made up of 5 subscales: problem-solving, number sense, computation, algebra, geometry, and statistics. Scores for the iLearn and Control Groups on each of these subscales is shown below in Chart 4.
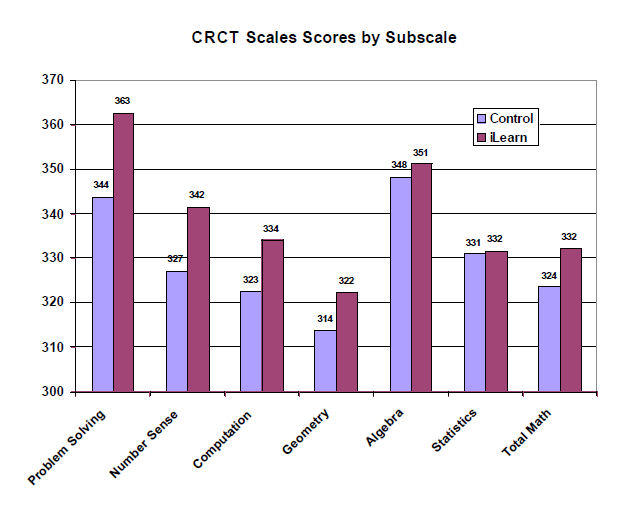
The results are ordered in terms of the size of the gain between groups from left to right, i.e., the largest gains are on the left and the smallest on the right. As shown above the largest differences in favor of iLearn Math were on the subscale for problem-solving followed by number sense, then followed by computation. This supports a conclusion that students were not simply learning rote computational skills but were able to apply their knowledge to solve new problems.
Copyright 2005 iLearn©, Inc.
Click below for other Resources